
China exported aggressively within Asia-Pacific and to Africa, Eastern Europe, and the Middle East.
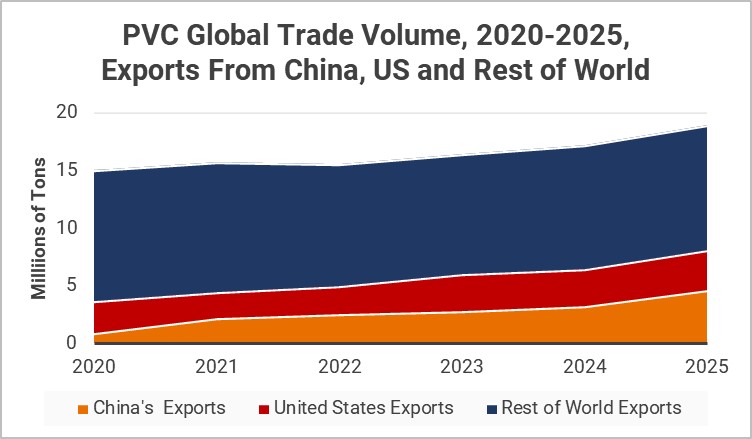
Over the 2020-2025 period, global trade in PVC rose from 15 million tons to 18.9 million tons, a CAGR of 4.7%. At the start, US exports of 2.8 million tons far exceeded China’s 0.8 million tons. The gap narrowed rapidly and became roughly equal around 3 million tons in 2023 and 2024. In 2025, China’s exports jumped 42% from 2024, to 4.6 million tons; US exports rose 9%, to 3.5 million tons. (Note: PVC global trade volume is for all grades combined, measured as exports or imports, which are equal.)
China’s exports surged in 2024 and 2025 mainly on trade within the Asia-Pacific region, but also on gains to Africa, Eastern Europe, and the Middle East. Leading volume markets included: India, Vietnam, Thailand, Indonesia, Egypt, Nigeria, Russia, Kazakhstan, Uzbekistan, UAE, Iraq.

From International Trader Publications’ continuously updated World Trade Analyses on PVC, compounded and uncompounded, and, The China Polymer Trade Report, analyzing China’s imports and exports by country and region for all grades of PE, PP, PS, Styrenic Polymers, PVC, PET, recyclable polymers, and key fabricated plastic products.