
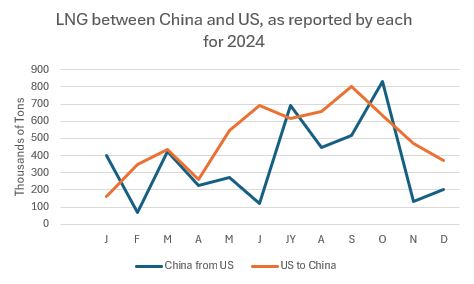
As of February 4th, 2025, the US imposed a 10% tariff on all imports from China. Part of China’s response was to levy a 15% tariff on LNG imports from the US, to go into effect February 10th. In 2024, China reported 4.3 million tons of LNG imports from US; the US reported 6.0 million tons of exports to China, a difference of 1.7 million tons.
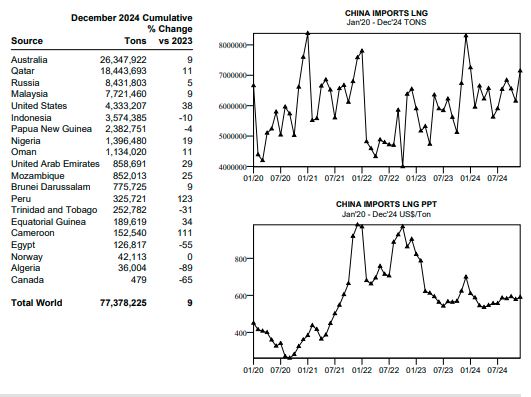
China’s total imports of LNG in 2024 were 77.4 million tons, the 4.3 million tons from the US accounting for about 6%. Top suppliers were Australia, Qatar, Russia, and Malaysia, followed by the US.
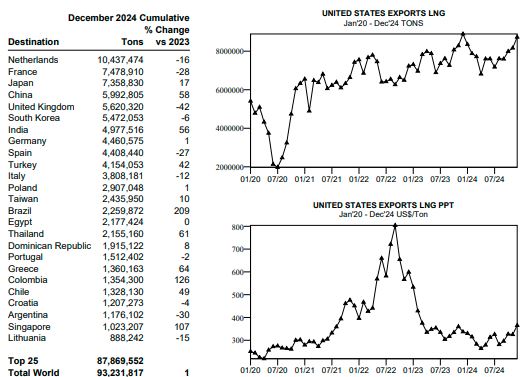
The US reported a total of 93.2 million tons of LNG exports in 2024, about 6% of which, 6.0 million tons, went to China. Of the US total, 38% went to EU countries, 26% to Asia-Pacific countries other than China, and the remaining 30% to numerous world markets, including Turkey, Brazil, Egypt, Kuwait, Jordan, Bangladesh, and others.
Some of the 1.7 million ton discrepancy between US and Chinese statistics can possibly be accounted for by material still in transit toward the end of the year. The graph shows roughly a lag of about a month between the US export figure and the Chinese import figure, especially evident in June/July and September/October. Persistently lower volume were reported by China nearly every month. Trading partner statistics often differ, with export statistics generally less reliable than import statistics because import statistics are monitored more closely and because the final destination may not be as stated. Other factors can include: different conversion formula for converting US volume reported in cubic meters to tons reported by China, resale of US LNG to other countries, and actual underreporting.
From International Trader Publications’ LNG World Trade Analysis, a continuously updated analysis of global trade developed from trade statistics from all reporting countries.