
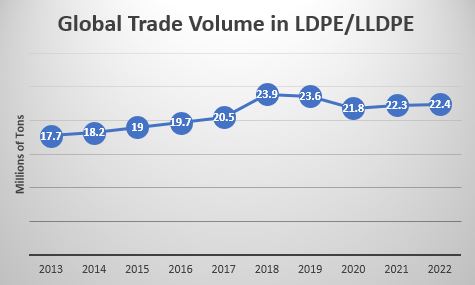
Global trade in LDPE/LLDPE was 22.3 million tons in 2022. LDPE/LLDPE accounted for 33% of the 68 million tons of all grades of ethylene polymers traded globally that year.
LDPE/LLDPE is defined as low or linear low density polyethylene with ethylene monomer content equal to or greater than 95%. Statistics available from countries that separately define LDPE from LLDPE within this category indicate that of the 22.3 million tons of combined LDPE/LLDPE, about 8 million tons are linear polymer and 14.3 million tons are conventional high pressure or other low density polyethylene.
In 2013, ITP quantified 17.7 million tons of trade in LDPE/LLDPE. Volume expanded gradually each year, peaking at 23.9 million tons in 2018. Trade declined in 2019 and 2020, then rose marginally in both 2021 and 2022. ITP projects a 1% decline in global trade volume in 2023, to 22.1 million tons.
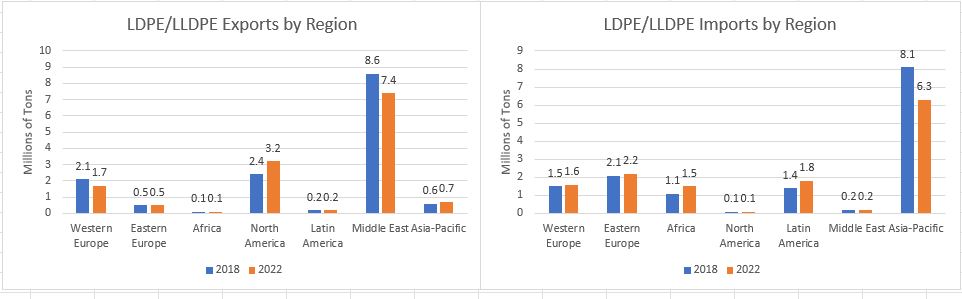
The following graphs illustrate the changes that have occurred over the period 2018-2022 in how much LDPE/LLDPE is exported by each region to other regions and how much is imported into each region from other regions (both excluding intra-regional trade). Prominent are the decline in exports out of the Middle East and also Western Europe and higher volumes out of North America and Asia-Pacific. On the import side, Asia-Pacific volumes were down 23% over the period but imports into other regions, especially Africa and Latin America, were up.
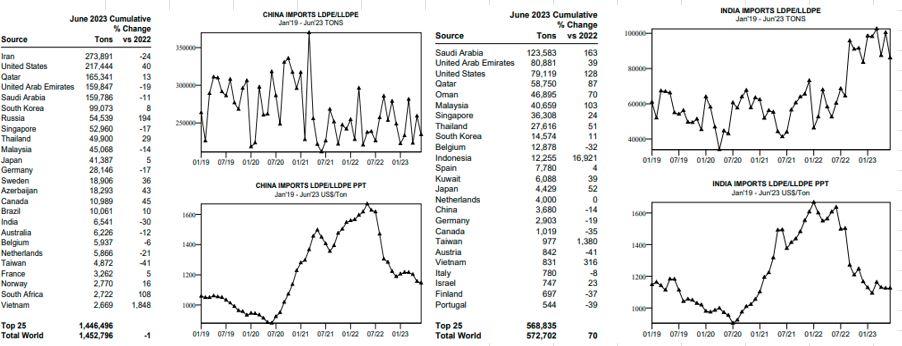
As it did for other polyethylene grades, China greatly influenced global trade. Imports were low from mid-2021 continuing through June 2023. India, by contrast, was a strong growth market over the last twelve months.
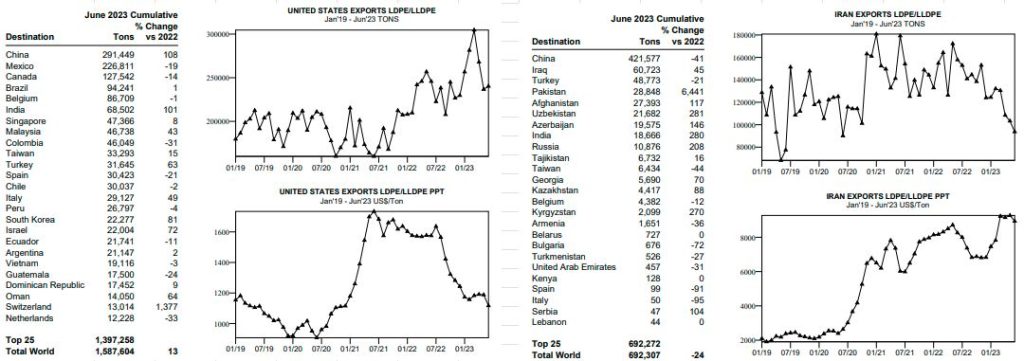
Exports of LDPE/LLDPE out of the US trended higher from early 2022, with shipments through June 2023 totaling 1.6 million tons, up 13% from the first half of 2022. Exports to China more than doubled. Iran’s exports through June were 0.7 million tons, down 24%, with much lower volume to China a factor in the decline.
From International Trader Publications LDPE/LLDPE World Trade Analysis, a continuously updated online analysis of global trade developed from trade statistics from all available countries.