
The volume of polyethylene traded globally expanded strongly from 2013 through 2019 but then slowed and, in 2021 and 2022, contracted.
In 2013 ITP quantified 47.8 million tons of polyethylene global trade. There were particularly sharp gains volume in 2017, 2018 and 2019 but a much smaller gain in 2020, with volume at 70.9 million tons. Global trade declined in 2021 and 2022, falling to 68 million tons in the latter year:
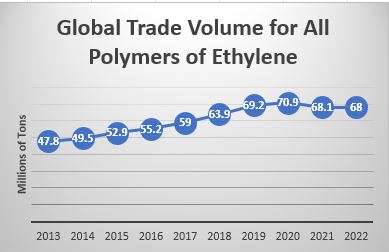
(ITP projects global volume down 1% through June 2023 versus the first half of 2022, to 34 million tons).
There are five main grades of polyethylene, with LDPE/LLDPE and HDPE accounting for nearly 70% of the total.
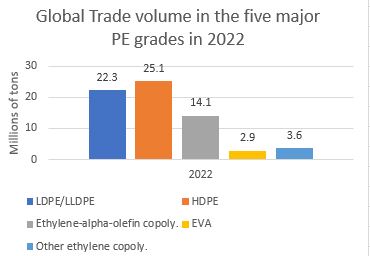
Within LDPE/LLDPE the volume of linear low density polyethylene versus high pressure low density polyethylene varies by region but is estimated at roughly 35% of the LDPE/LLDPE total.
Ethylene-alpha-olefins copolymers is a new designation for polyethylene, created in 2017 by the World Customs Organization, and is believed to be virtually all linear polyethylene.
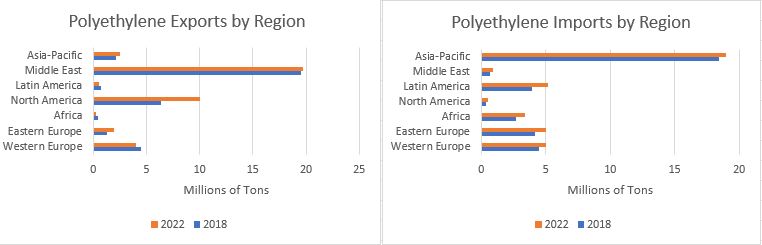
On a regional level, the most striking changes in polyethylene exports from 2018 to 2022 were the surge in shipments out of North America and, by comparison, the relatively small increase in volumes out of the Middle East. Imports increased into every region, with the largest percentage gains in Europe, Latin America and Africa.
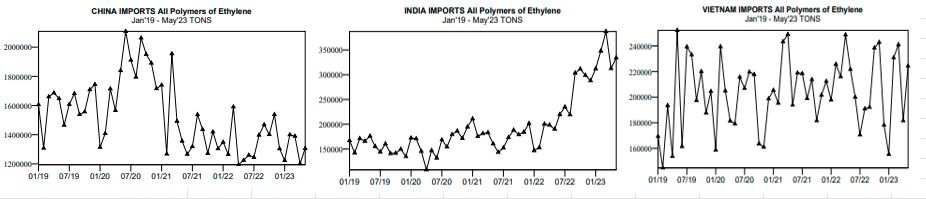
ITP analyzes trade based on import/export statistics, vetted for accuracy, from over 100 countries. The slowdown in China’s imports of polyethylene was a key factor in the decline in global trade volume from 2021 through May 2023. Much higher imports into India and Vietnam, also pictured, as well as other countries, did not fully offset the decline.
From International Trader Publications’ All Polymers of Ethylene World Trade Analysis, a continuously updated online analyses of global trade based on latest available statistics.