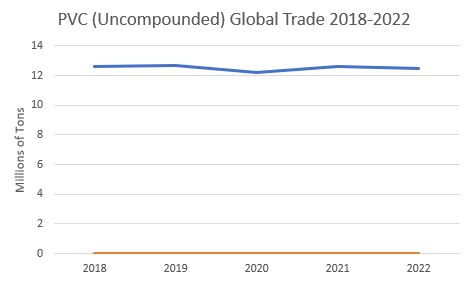
The volume of uncompounded PVC traded globally has stayed remarkably constant over the last several years, but there have been profound changes in imports and exports on a regional level.
The volume of uncompounded PVC traded globally has hovered around 12.5 million tons from 2018 to 2022. Trends in global trade volume generally indicate trends in global demand.
The following graphs show imports into each region from other regions and exports by each region to other regions, both of which exclude intra-regional trade.
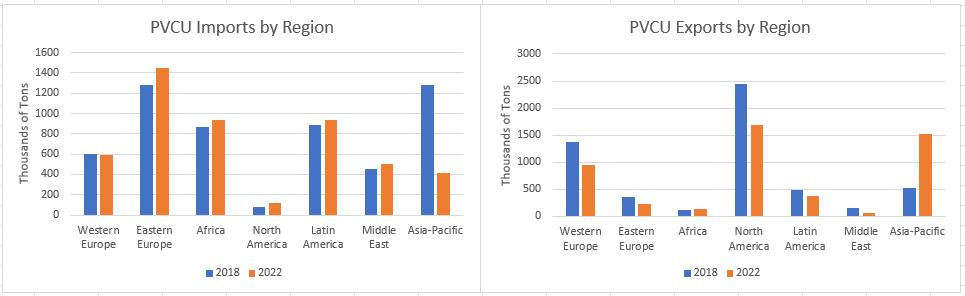
On the import side, the most striking change was the 70% drop in imports into Asia-Pacific, from 1.3 million tons in 2018 to 410,000 tons in 2022. Imports into all other regions except Western Europe, which was flat, showed small to moderate gains.
Of particular note on the export side was the surge in shipments out of Asia-Pacific, from 524,000 tons in 2018 to 1.5 million tons in 2022. Exports out of other major regions fell although data through May 2023 shows a recent jump in US exports.
Data through May 2023 shows China exporting 993,000 tons to all trading partners, down 6% from the same period in 2022. Exports from the US were 1.4 million tons through May, up 59%.
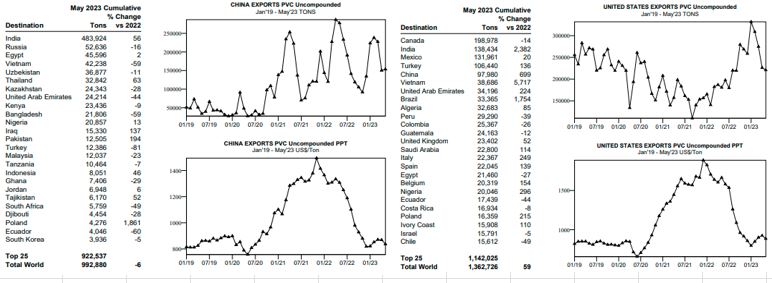
From International Trader Publications’ Uncompounded PVC World Trade Analysis, a continuously updated online analysis of global trade.